 Inquiry

- Product Info
- SUMIKAEXCEL PES
- Mechanical properties
Mechanical properties of SUMIKAEXCEL PES
Short-term deformation
Tensile Test
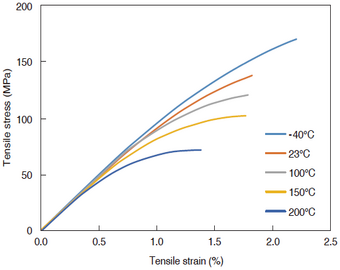
The stress-strain curve (hereinafter referred to as SS curve) in a tensile test of SUMIKAEXCEL PES is shown below. Until the stress reaches a certain level, the relationship between strain and stress is proportional. When designing the strength of PES, it is necessary to take into consideration that there are some areas where the relationship between stress and strain is not proportional.
Figure 3-2-1 SS curve of tensile strength of 4100G
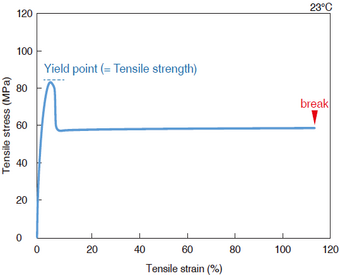
Figure 3-2-2 SS curve of tensile strength of 4101GL30
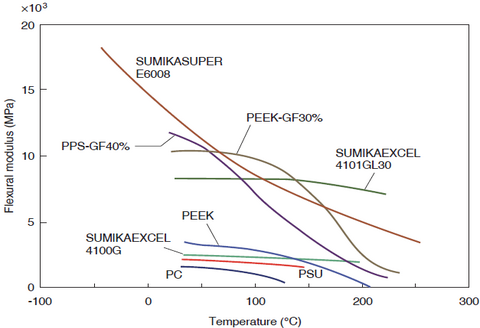
Temperature dependence of flexural modulus
Its heat distortion temperature is 200-220°C, and its continuous use temperature is UL temperature index certified at 180-190°C.
The elastic modulus hardly changes in the temperature range from -100 to 200°C. In particular, at temperatures above 100°C, it is at the highest level of any thermoplastic resin.
Figure 3-2-3 Temperature dependence of flexural modulus
Impact strength
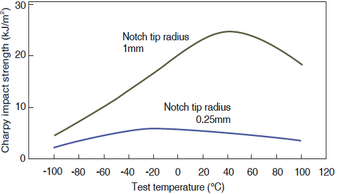
SUMIKAEXCEL PES is a tough resin with excellent impact resistance. The Izod impact strength is shown below in comparison with other heat-resistant resins, and it can be seen that the unreinforced grade without a notch does not break. Figure 3-2-6 also shows the temperature dependence of impact strength. We can see that SUMIKAEXCEL PES has sufficient impact strength even at temperatures below 0°C, for example -100°C.
Figure 3-2-4 SUMIKAEXCEL PES
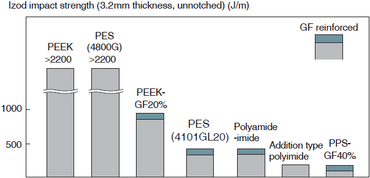
Figure 3-2-5 Dependence of impact strength on notch tip radius at 20℃ (4800G)
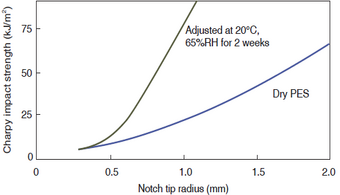
Figure 3-2-6 Temperature dependence of impact strength (4800G)
Weld Strength
When injection molding, the strength of welds (resin joints) is lower than that of non-welds. The strength of welds in glass fiber reinforced grades decreases depending on the glass fiber content. Figure 3-2-7 shows a comparison of non-weld and weld strength, and Table 3-2-1 shows the tensile strength of the welds of SUMIKAEXCEL PES.
We can see that SUMIKAEXCEL PES has extremely high weld strength compared to other resins. In particular, the unreinforced grade shows almost no loss in reinforcement in the welds, and has the same strength as the non-weld areas.
Weld tensile strength
Figure 3-2-7 Tensile strength
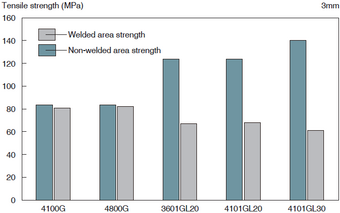
Table 3-2-1 Tensile strength of welds
(Unit: MPa)
| Grade | Non-weld area | Weld part |
|---|---|---|
| 4100G | 84 | 81 |
| 4800G | 84 | 82 |
| 3601GL20 | 124 | 67 |
| 4101GL20 | 124 | 68 |
| 4101GL30 | 140 | 61 |
Weld bending strength
Figure 3-2-8 Shape of molded product for weld evaluation
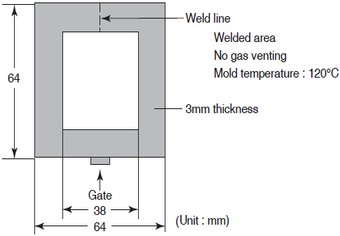
Table 3-2-2 Bending strength and Izod impact strength of welded and non-weld parts
| Grade | Bending strength (MPa) | Izod impact strength (J/m) | ||||
|---|---|---|---|---|---|---|
| No notch | 0.25 notch | |||||
| Non-weld area | Weld part | Non-weld area | Weld part | Non-weld area | Weld part | |
| 4100G | 140* | 140* | >1960* | 2156 | 68 | 49 |
| 4101GL20 | 190 | 110 | 411 | 117 | 68 | 29 |
| 4101GL30 | 180 | 110 | 362 | 98 | 68 | 29 |
| PPS-GF40% | 170 | 70 | 166 | 29 | 49 | 19 |
* = No breakage.
| Forming machine: | Sumitomo Heavy Industries Neomat N47/28 |
| Injection pressure: | 130MPa |
| Injection speed: | 60% |
| Cylinder temperature: | 340℃ (4100G) 350℃ (4101GL20/4101GL30) |
| Injection Time: | 10 seconds |
| Cooling time: | 20 seconds |
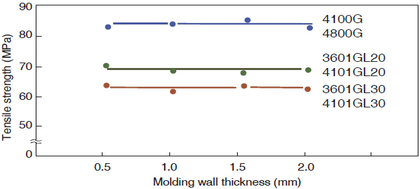
Weld strength of thin-walled molded products
Figure 3-2-9 Relationship between molded product thickness and tensile strength of welds
Improved weld strength
If the reduction in strength caused by welds becomes a practical problem, the following methods may be able to improve the situation.
- Improvement by annealing
The strength of the welds in glass fiber reinforced grades can be improved by 15 to 20% by annealing at 150 to 180°C.
Suitable annealing conditions are 150°C x 20 minutes for a wall thickness of 0.5 to 1.5 mm, and 180°C x 180 minutes for a wall thickness of 2 mm.
Table 3-2-3 Improvement in tensile strength of welds by annealing
(Unit: MPa)
| Grade | Before annealing | 150℃ | 180℃ | |
|---|---|---|---|---|
| 20min | 20min | 180min | ||
| 3601GL20 | 68 | 76(113%) | 76(113%) | 77(114%) |
| 4101GL20 | ||||
| 3601GL30 | 61 | 75(123%) | 75(121%) | 75(121%) |
| 4101GL30 | ||||
() indicates strength before annealing
Ratio when taken as 100%
- Improvement by mold temperature
The weld strength increases when the mold temperature during molding is higher, so try raising the mold temperature to 160-180°C.
Long-term deformation
Creep
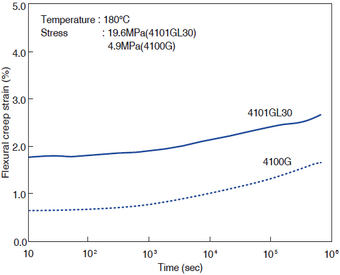
When calculating the strength of practical parts, it is necessary to avoid using only the strength and modulus of elasticity obtained by standard tests (e.g. ASTM). When determining the optimal design, it is necessary to consider the dimensional and strength changes of the molded product under the conditions of use, based on the creep properties and the property changes due to temperature. Figure 3-2-10 shows the tensile creep properties of the unreinforced grade 4800G at 20℃ and 150℃. As is clear from the figure, SUMIKAEXCEL PES has excellent creep resistance. For the unreinforced grade, the creep deformation after three years at 20℃ and a load of 20MPa is only 1%, and at 150℃, the creep deformation after three years at a load of 10MPa is only 1%. Figure 3-2-11 shows the bending creep properties of the glass fiber reinforced grades (3601GL30, 4101GL30) at 150℃. It can be seen that SUMIKAEXCEL PES has excellent creep properties compared to crystalline PPS (40% glass fiber reinforced grade).
Figure 3-2-10 Non-reinforced grade (4800G)
Tensile creep properties
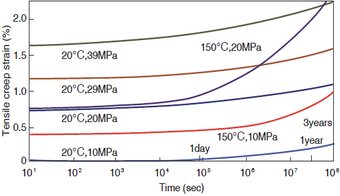
Figure 3-2-11 Glass fiber reinforced grades (3601GL30, 4101GL30)
Bending creep properties
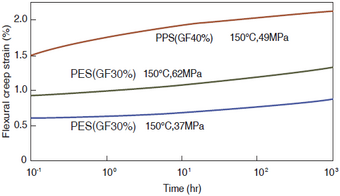
Figure 3-2-12 Non-reinforced grade (4100G)
Tensile creep properties
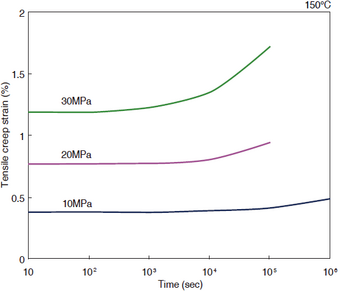
Figure 3-2-13 Glass fiber reinforced grade (4101GL30)
Tensile creep properties
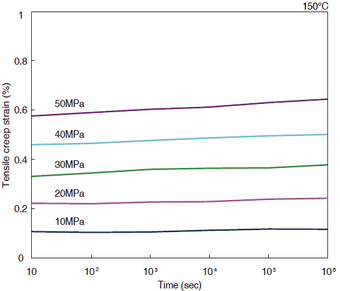
Figure 3-2-14 Bending creep properties
Fatigue properties
Materials subjected to long-term fluctuating loads will undergo fatigue failure. The stress-life curve from a tensile fatigue test is shown below.
At a temperature of 23±1°C and humidity of 60±5%, it will not break down due to fatigue up to approximately 1.0× 10⁷ times even when subjected to a repeated load of 30 MPa.
Figure 3-2-15 SUMIKAEXCEL non-reinforced grade
Stress-life curves for (3600G, 4100G, 4800G)
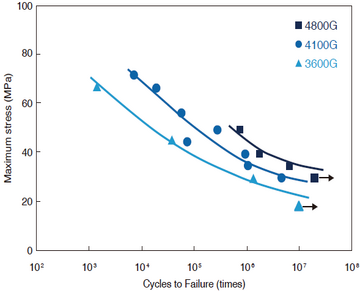
Figure 3-2-16 SUMIKAEXCEL glass reinforced grade
(3601GL20, 4101GL30) Stress-life curve
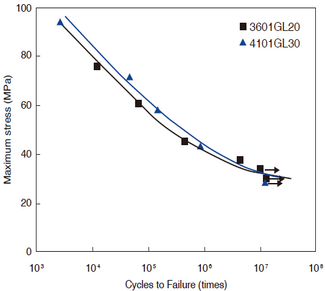
* A symbol with a right arrow (→) indicates that the test specimen did not break during that number of repetitions.