- Product Info
- SUMIKASUPER LCP
- Heat resistance of LCP
Heat resistance of SUMIKASUPER LCP
Deflection Temperature under Load
The deflection temperature under load for each grade of SUMIKASUPER LCP is as follows:
The deflection temperature under load can be used as a general indicator of short-term heat resistance. Please be careful not to confuse the test results performed under different measurement stresses (0.45MPa and 1.82MPa).
Table 3-1-1 Deflection temperature under load of SUMIKASUPER LCP
| Measurement Load | 0.45MPa | 1.82MPa |
|---|---|---|
| E5000 Series | 350~390℃ | 330~360℃ |
| E4000 Series | 330~340℃ | 300~320℃ |
| E6000 Series SV6000 Series SR1000 Series |
300~320℃ | 270~290℃ |
| E6000HF Series SV6000HF Series |
280~320℃ | 250~280℃ |
| SZ6000HF Series SR2000 Series |
270~300℃ | 240~270℃ |
Deflection temperature under load and normal usable temperature
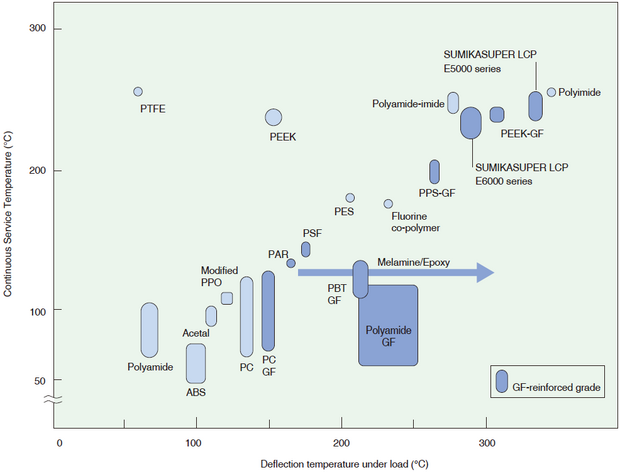
SUMIKASUPER LCP has an excellent balance between deflection temperature under load and normal usable temperature.
Figure 3-1-1 Normal usable temperature and deflection temperature under load (load 1.82 MPa)
Decomposition temperature
The results of TGA (thermogravimetric analysis) show that the decomposition temperature in nitrogen is high at approximately 450°C, and the weight loss at 500°C is very small at less than 1%, indicating that SUMIKASUPER LCP has high thermal stability.
Figure 3-1-2 TGA curves of SUMIKASUPER LCP and other engineering plastics
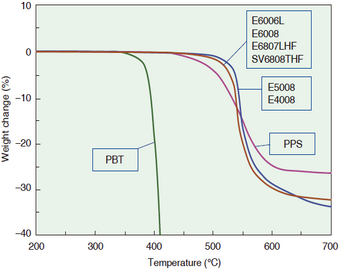
Table 3-1-2 Thermal decomposition temperature of SUMIKASUPER LCP
| Resin | Decomposition temperature (℃) | |
|---|---|---|
| 1% weight loss temperature | Main decomposition temperature | |
| E5008 E5008L |
520 | 559 |
| E4008 | 520 | 555 |
| E6008 E6006L |
500 | 550 |
| E6007LHF E6807LHF SV6808THF SZ6505HF |
500 | 550 |
| PBT-GF30 | 370 | 421 |
| PPS-GF40 | 460 | 556 |
| Measuring equipment: | Shimadzu TG50 type |
| Heating rate: | 10℃/min |
| atmosphere: | In nitrogen |
Dynamic Mechanical Analysis (DMA)
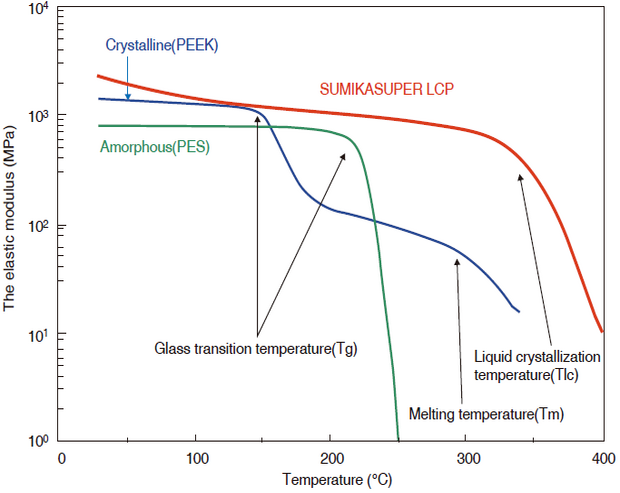
The dynamic viscoelasticity data of the temperature dependence of the elastic modulus of SUMIKASUPER LCP compared with a crystalline polymer (PEEK) and an amorphous polymer (PES) is shown below. While PEEK shows a significant drop in the elastic modulus at 140°C, SUMIKASUPER LCP maintains high mechanical properties even at temperatures above 200°C and does not exhibit glass transition behavior. In fact, thermal analysis using a differential scanning calorimeter (DSC) does not show a thermal transition (Tg) like that seen in conventional crystalline and amorphous polymers. SUMIKASUPER SUMIKASUPER LCP appears to melt at the liquid crystal temperature (Tlc). This has the advantage that the mold temperature can be freely set as long as it is below the molding temperature.
Figure 3-1-3 DMA curve of SUMIKASUPER LCP
Heat and water resistance
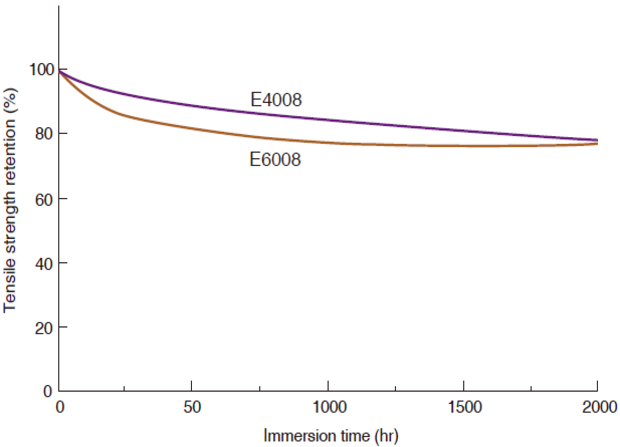
It retains a practical level of strength even after immersion in 80℃ hot water for 2000 hours. However, it cannot be used in steam at 120℃ or higher as hydrolysis will progress and the strength will decrease significantly.
Figure 3-1-4 Hot water resistance of SUMIKASUPER LCP (80℃)
Solder heat resistance
SUMIKASUPER LCP has the highest solder heat resistance among heat-resistant engineering plastics.
Table 3-1-3 Solder heat resistance of SUMIKASUPER LCP
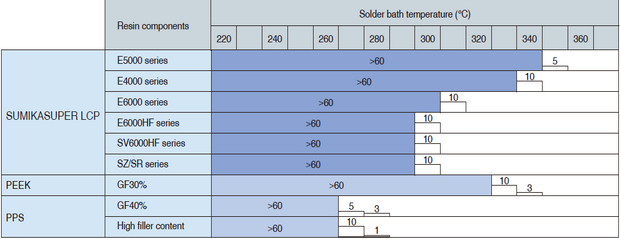
| Sample dimensions: | JIS K7113 1(1/2) dumbbell x 1.2mm |
| Solder: | H60A (60% tin, 40% lead) |
*The numbers in the figure indicate the limit number of seconds before deformation occurs (>60 means that no deformation occurs even if immersed for 60 seconds).
Depending on the molding conditions, foaming may occur below the deformation temperature mentioned above.
Long-term heat resistance
SUMIKASUPER LCP has excellent long-term heat resistance. The relative temperature index (RTI) of SUMIKASUPER LCP is as follows. RTI indicates the temperature at which the electrical properties (Elec) and mechanical properties (Mech) of impact strength (Imp) and tensile strength (Str) become half of their initial values after 100,000 hours of aging. Generally, thinner test pieces deteriorate faster, so UL performs RTI evaluation according to the thickness of the test piece.
Table 3-1-4 Relative temperature index of SUMIKASUPER LCP (UL746B)
| Grade | Thickness (mm) |
RTI | ||
|---|---|---|---|---|
| Electrical | impact | Tensile | ||
| E5008 | 0.75 | 240 | 200 | 220 |
| 1.5 | 240 | 220 | 240 | |
| 3.0 | 240 | 220 | 240 | |
| E5008L | 0.75 | 240 | 200 | 220 |
| 1.5 | 240 | 220 | 240 | |
| 3.0 | 240 | 220 | 240 | |
| E4008 | 0.15 | 220 | 200 | 220 |
| 0.30 | 240 | 200 | 240 | |
| 0.75 | 240 | 220 | 240 | |
| 1.5 | 240 | 220 | 240 | |
| 3.0 | 240 | 220 | 240 | |
| E6008 | 0.15 | 220 | 200 | 220 |
| 0.27 | 240 | 200 | 240 | |
| 0.54 | 240 | 220 | 240 | |
| 0.75 | 240 | 220 | 240 | |
| 1.5 | 240 | 220 | 240 | |
| 3.0 | 240 | 220 | 240 | |
| E6007LHF-MR | 0.50 | 220 | 210 | 210 |
| 0.75 | 220 | 210 | 210 | |
| 1.5 | 220 | 220 | 220 | |
| 3.0 | 220 | 220 | 220 | |
Arrhenius plot
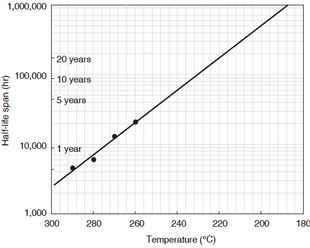
The thermal stability of a resin limits the temperature range over which the resin can be used for a long period of time. In UL-compliant RTI evaluation, the aging test is continued until the observed property value drops to half of its initial value. Aging tests are performed at several different temperatures, and an Arrhenius plot is created based on the data. An Arrhenius plot is a graph obtained by plotting the heat aging time (also called the half-life) required for the property value to drop to half of its initial value against the reciprocal of the aging temperature (K).
Figure 3-1-5 Temperature dependence of tensile strength half-life of SUMIKASUPER E5008
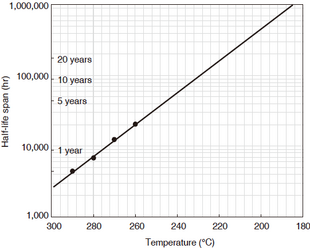
Figure 3-1-6 Temperature dependence of tensile strength half-life of SUMIKASUPER E6008
Heat aging resistance (260℃ in air)
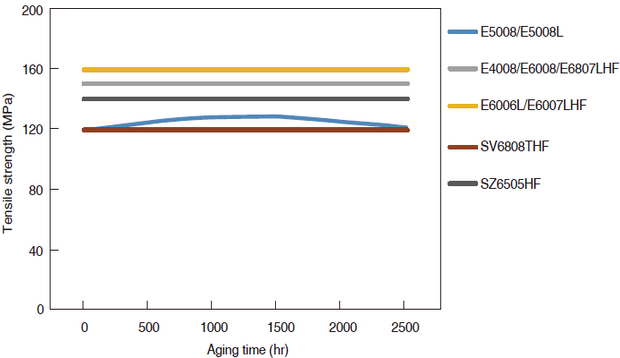
The strength retention performance of SUMIKASUPER LCP in air at 260℃ is as follows. There is almost no decrease in tensile strength even in air at 260℃.
Figure 3-1-7 Heat aging resistance (in air at 260°C)
